
PERFORMANCE TESTING
Cells and batteries differ, and performance varies widely. Mobile Power Solutions (MPS) tests to real-world conditions as defined by our customers, and our performance tests can be customized to your specific performance expectations. Battery performance testing is the electrical testing of cells and batteries combined with environmental conditioning. We simulate a range of external influences in our test chambers while the cell or battery is experiencing accelerated cycling. Concurrently, performance test data can be collected on the performance over the life of the cell or battery. Our performance tests and reports enable you to choose the optimal cell or battery configurations for your application. Additionally, our performance results ensure that your batteries exceed performance and warranty expectations over the life of your device and battery.
Cell testing investigates the dynamics of the chemical reactions to characterize electrochemical performance, and predicts the viability of cell performance within a battery module or pack. When testing cells, our experts can utilize electrochemical techniques to evaluate the internal chemical reactions, assess the quality of the cell material, and project how the cell will perform in the target environment.
Battery module and pack testing evaluates the overall battery performance as an aggregate unit, and address performance characteristics such as safety, thermal management, BMS performance, self-discharge, calendric and cyclic aging, and voltage output variability.
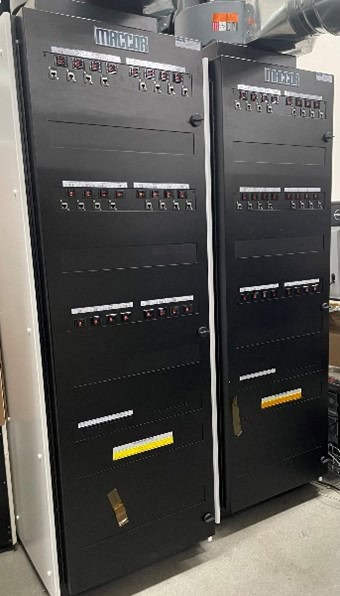
MACCOR Battery testers
Using the MACCOR battery testers in our test facility, we can simulate the dynamic load profiles and environmental conditions encountered over a cell or battery lifetime. Cell capacity and rate capability degrade due to discharge cycles, temperature, age, and charge cycles. Understanding the performance curves over the life of the cell enables device manufacturers to establish their warranty period and conditions.
Electrochemical impedance spectroscopy (EIS) is an established method that provides insights into the electrochemistry and kinetics within a Lithium cell. EIS is a powerful analytical tool which enables non-destructive insights into the materials and the manufacturing processes of the cells. EIS can also be used as a predictor of performance and degradation mechanisms.
Most cell manufacturers provide “canned” performance reports generated under optimal conditions. However, the detailed energy/power/storage performance characteristics of a cell, such as the effect of charge/discharge rate or prolonged cell cycling, in a specific usage profile is usually generated in an independent test facility. See Example B – EIS as a Function of Cycle Count.
Over time, charging and discharging a Lithium-ion cell leads to a degradation of its performance characteristics, such as capacity, impedance, and possibly, safety. The degradation is caused by mechanical, chemical, or structural modifications of the cell components during charge/discharge cycling or storage at elevated temperature. Differential Capacity Analysis (DCA) is a method for characterizing State of Health (SoH) in electrochemical cells. DCA Studies identifiy the voltages at which charge transfer processes occur and quantify it as a function of cycle count. DCA Studies identify and quantify the effects of the degradation mechanisms throughout the life of the cell, and these mechanisms are typically grouped into three categories; conductivity loss, loss of active material, and loss of charge carrying ions. See Example C – Differential Capacity Analysis.
Our experienced staff can consult on your initial performance tests, and add their decades of experience with mobile device and battery performance. Our testing facilities provide complete data acquisition (including video) for all performance and safety testing. Our equipment is calibrated to NIST traceable standards, and housed in a controlled temperature environment. MPS routinely performs hazardous tests in our performance testing, which may result in small explosions, fires, and vented gases.
Standard Performance Analysis
Cell and battery performance analysis reveals data about its capacity for energy storage, as well as power delivery capability through its cycle life. Our performance analysis uses electrical tests to measure battery qualities and capabilities. Our standard cell and battery performance analysis includes;
- Cycle life
- Capacity and charge retention
- Charging and discharging rate capability (pulse)
- Duty cycle
- Open Circuit Voltage (OCV)
- Accelerated life and storage analysis
- Environmental conditions (temperature, pressure, vibration, humidity)
- Destructive physical analysis
Custom Performance Testing
MPS can perform custom safety and performance testing with full data acquisition and analysis. Based on our years of experience in cell qualification and battery manufacturing, MPS can develop customized performance tests that address your real-world or corner-case usage scenarios, as well as any concerning scenarios our experts can envision for your product. Examples of customized performance test include;
- Cell, module subassembly, and battery testing of all formats and configurations
- Cycling combined calendric aging
- Cycling within varying temperature ranges (– 60 to +100 degrees C)
- HPPC testing
- Recording volumetric measurements while cycling
- Electrochemical Impedance Spectroscopy (EIS)
In summary, our performance testing can benefit manufacturers in many ways during cell, battery, or product development. Reasons for performance testing include; selection of the optimal cell for inclusion in a battery, characterization and optimization of cell formulation, evaluation of prototypes early in the development phase, performance benchmarking to support product specifications, developing warranty specifications and exclusions, assessing finalized product at product launch, and measuring quality assurance.
Example A – Discharge Rate and Rated Capacity
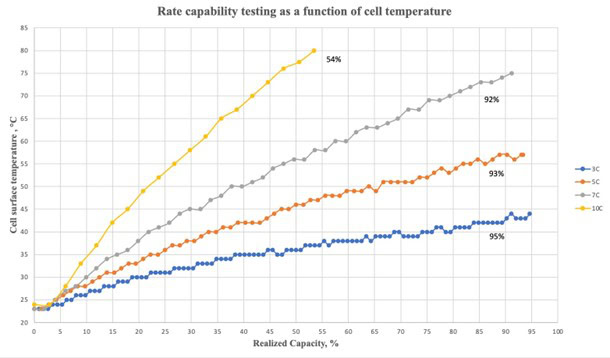
This graph shows the rate capability for a high power cell discharging at rates ranging from 3C to 10C. This graph shows the percentage utilization of the rated energy (as per the cell manufacturer) before hitting either the low voltage cut-off threshold or the thermal limit (80°C) for the cell.
Example B – EIS as a Function of Cycle Count
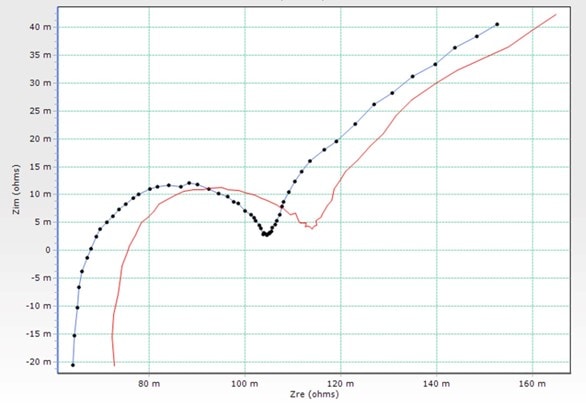
The graph shows an Electrochemical Impedance Spectroscopy (EIS) recording for a fresh high power cell measured at cycle 1 and after 250 cycles. This data can be used to optimize new material formulations, and provides valuable information about cell kinetics and degradation mechanisms.
Example C – Differential Capacity Analysis
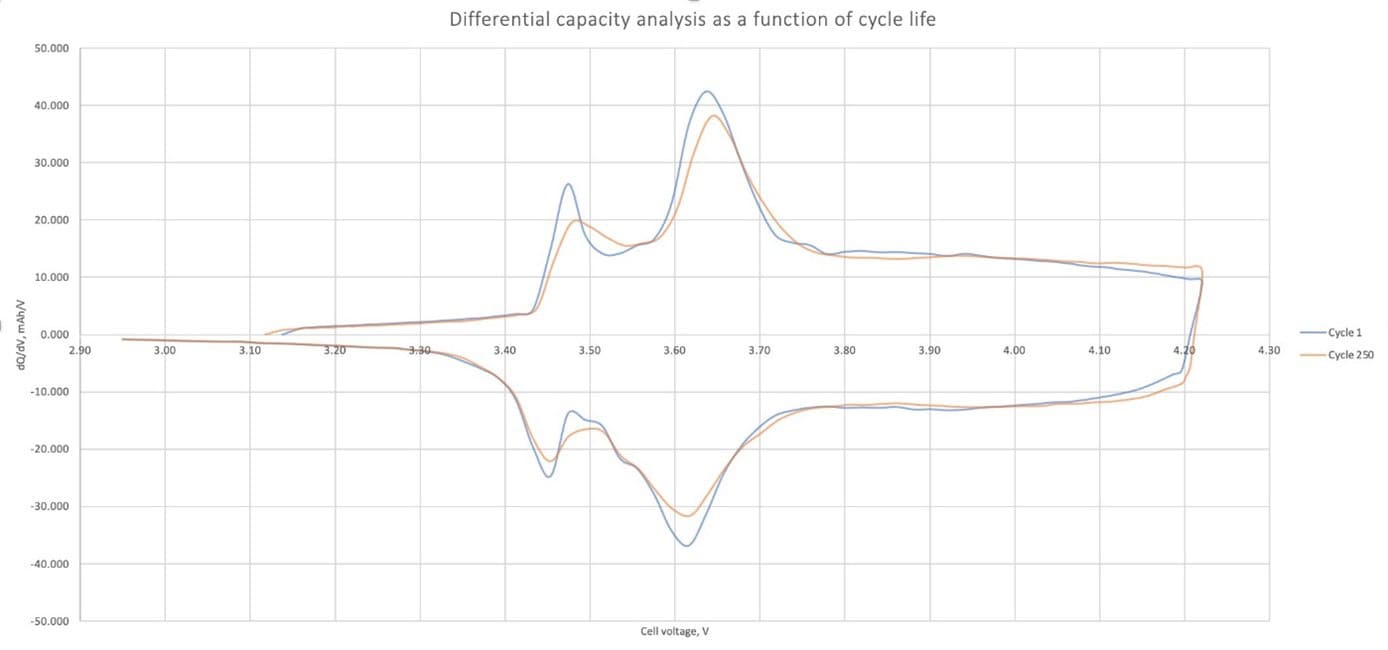
This graph compares the Differential Capacity Analysis (DCA) scans for a cell at cycle 1 and cycle 250. This slow charge and discharge rate shows the voltage at which charge transfer occurs. By comparing the position and magnitude of the peaks at different cycles (i.e. cycle 1 and cycle 250), it’s possible to determine key performance characteristics. This includes quantifying degradation mechanisms and identifying potential mitigation methods, either in the cell manufacturing process or in the usage profile for the mobile device.
Example D – Voltage vs Current vs Capacity over Time
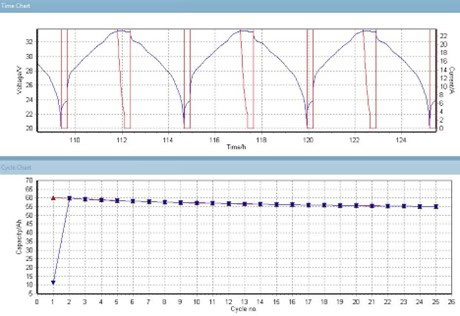
These two graphs show the relationship of Voltage, Current, and Capacity as a battery is repeatedly cycled over time.
